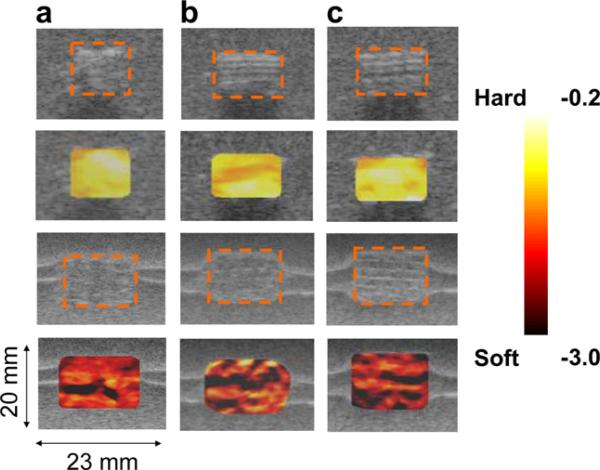
Fig. 3.
In vitro strain maps overlaid on top of the B-scan for the scaffold samples from the same batch before degradation (first two rows) and after (a) 41.6%, (b) 45.5% and (c) 42.0% degradation by weight (third and fourth rows). The dotted orange boxes represent the scaffolds. The average normalized strain generated inside of the scaffold after the degradation (–2.97 ± 0.74) of about 43% by weight was much higher than before the degradation (–0.43 ± 0.03) of the scaffolds. The coefficient of variation (COV = standard deviation/mean) after the degradation (25%) was much higher than before the degradation (7%). The inhomogeneity of the strain map also reflects the possible heterogeneous distribution of the internal structural degradation. In the lower two columns, the horizontal bright lines around the scaffolds are due to the ultrasound reflection between the layers formed during gel phantom fabrication. These do not affect the mechanical property of the phantom.

