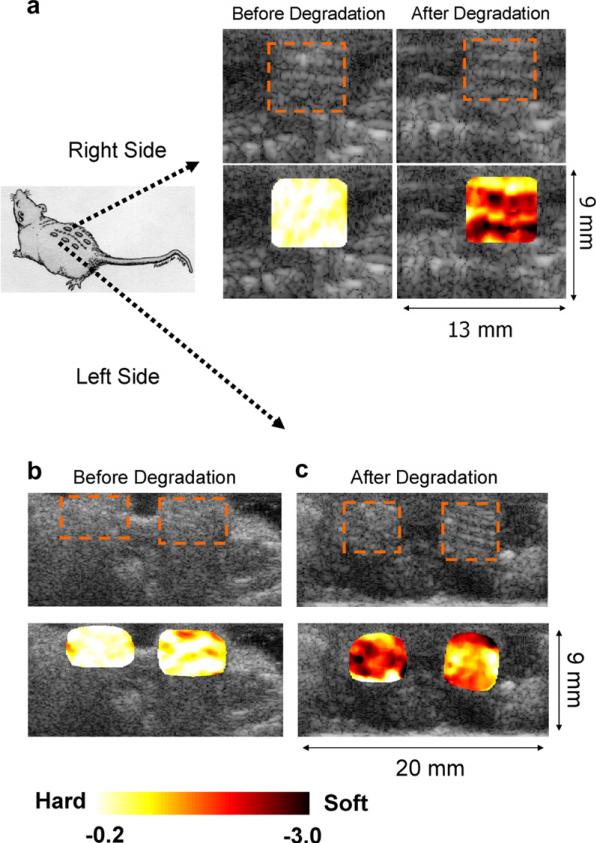
Fig. 5.
In vivo strain maps overlaid on top of B-scan for the scaffold samples implanted underneath of the skin on the right (a) and left hand sides (b, c) of the mouse back before and after degradation by weight ((a), 13.6%, left side of (c), 26.5%, and right side of (c) 28.6%). Overall, the scaffolds after the degradation of about 23% by weight generated much higher strains (–1.40 ± 0.24) than those before the degradation (–0.21 ± 0.01). The COV before the degradation (4.8%) was increased to 17% after the degradation. The inhomogeneity of the strain map also reflects the possible heterogeneous distribution of the structural degradation.

