
Figure 3.
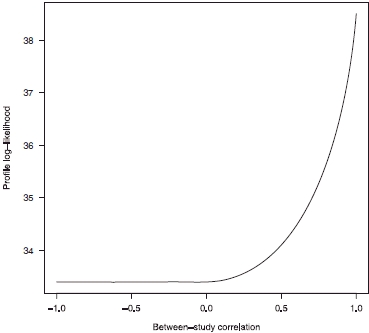
Profile log-likelihood plot for κ using the analytic within-cohort correlations, shown in column 7 of Table I.
Official websites use .gov
A
.gov website belongs to an official
government organization in the United States.
Secure .gov websites use HTTPS
A lock (
) or https:// means you've safely
connected to the .gov website. Share sensitive
information only on official, secure websites.
Profile log-likelihood plot for κ using the analytic within-cohort correlations, shown in column 7 of Table I.