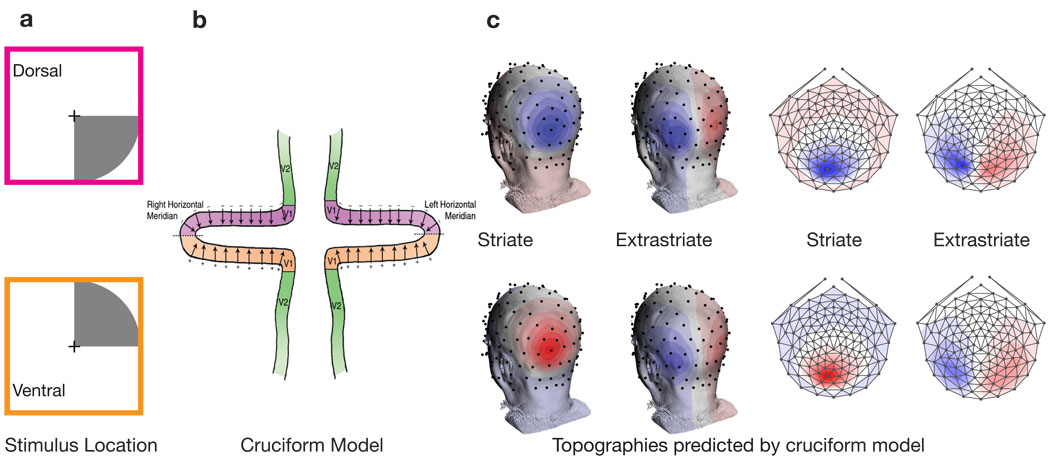
Figure 1.
The upper plot in panel a) shows a lower visual field stimulus that will activate dorsal visual areas, while the lower plot shows an upper visual field stimulus that will activate ventral areas. Panel b) depicts the cruciform model of the anatomically organization of V1 and V2. The arrows in V1 represent predicted source orientations. This model predicts sources in V1 flipping orientation while V2 source maintain a consist orientation. The predicted topographies of this model are shown in panel c). The top row corresponds to sources in dorsal areas, while the bottom row corresponds to ventral areas. The topography simulations were realized by placing sources in V1 and V2 with orientations as specified by the cruciform model in panel b). Panel d) shows a flattened representation of the topographies in panel c).

