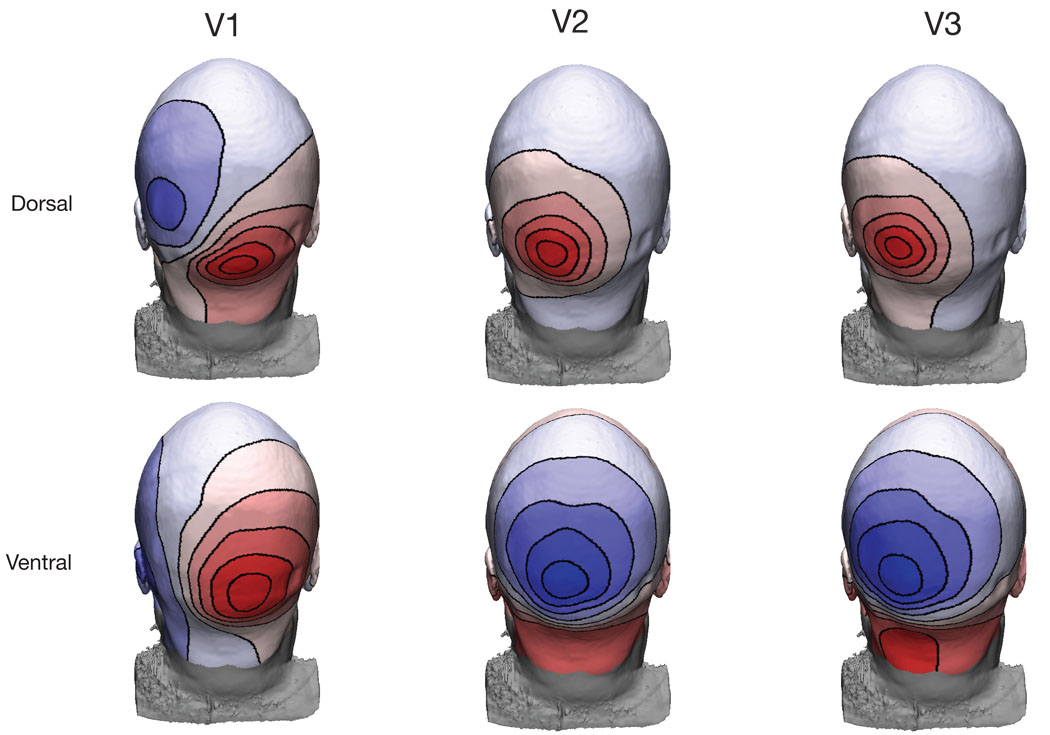
Figure 6.
Predicted scalp topographies from early visual areas in a single participant. Each plot contains the results of simulating a uniform source in a single visual area. Each colormap is scaled separately to highlight the shape of the topography. The topographies in V1 do not full invert, but appear to rotate about 90 degrees, resulting in only a few locations showing polarity flips. While the V2 and V3 sources exhibit many places where voltages completely reverse polarity.

