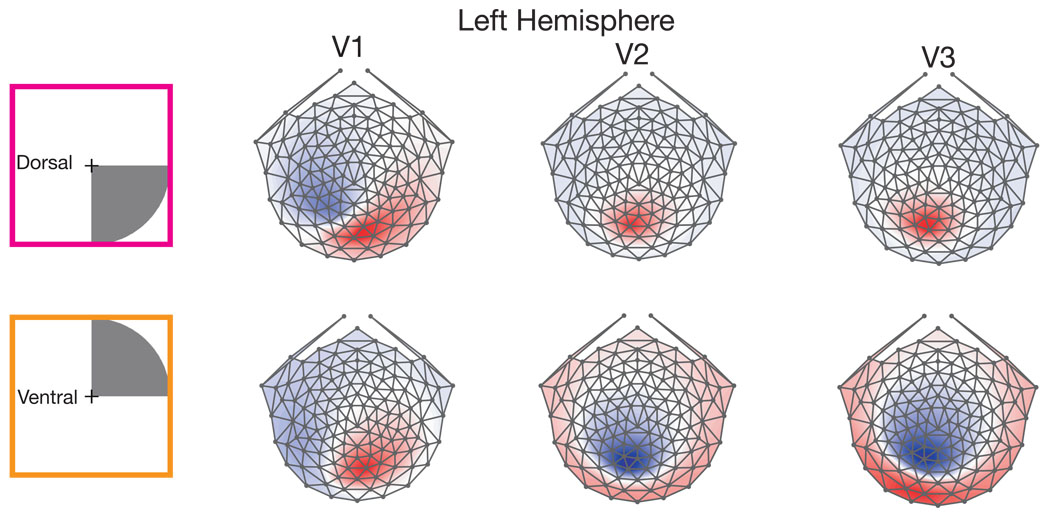
Figure 7.
Simulated topographies averaged over 12 participants in the study. A schematic of the simulated 4 degree radius quadrant stimulus is shown on the far left. The same pattern as demonstrated by the individual subject in Figure 6 appears on the cross subject average. The topographies in V1 do not full invert, but appear to rotate about 90 degrees, resulting in only a few locations showing polarity flips. While the V2 and V3 sources exhibit many places where voltages completely reverse polarity.

