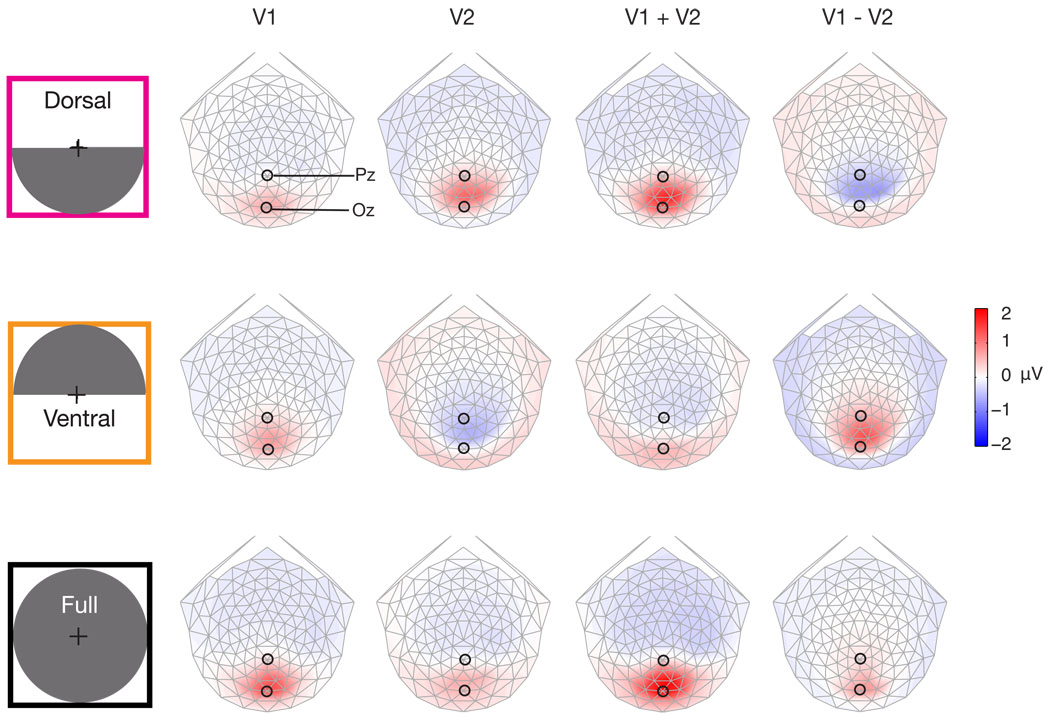
Figure 9.
Simulated linear combinations of V1 and V2 for bilateral stimuli. The first row contains topographies for a bilateral lower visual field (dorsal) stimulus. The middle row contains simulations for a bilateral upper visual field (ventral) stimulus. The bottom row contains the topographies for a full field stimulus. Note all topographies are identically scaled, and the color scaling is twice that of Figure 8. The only time the scalp voltage for a V1 source is larger than V2 is for the full field stimulus. For bilateral upper/lower visual field stimuli V1 has a consistent polarity at between Pz and Oz, while V2 reverses polarity.

