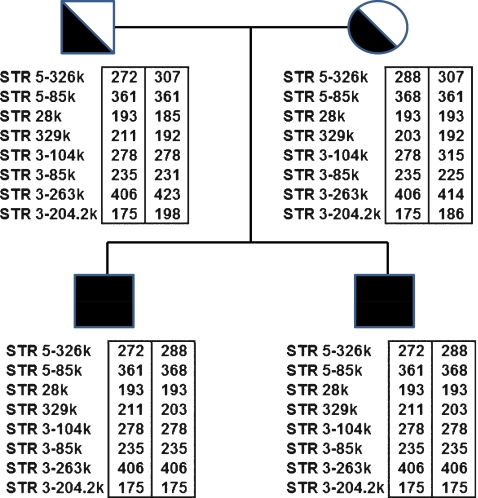
Fig. 1.
STR analysis of father, mother, and affected fetuses (black square) and resulting PKHD1 haplotypes. Informative STRs are ordered from the 5′ end (top) to the 3′ end (bottom). The numbers within the boxes next to each STR represent allele sizes in base-pairs (bp). Haplotypes are enclosed in boxes

