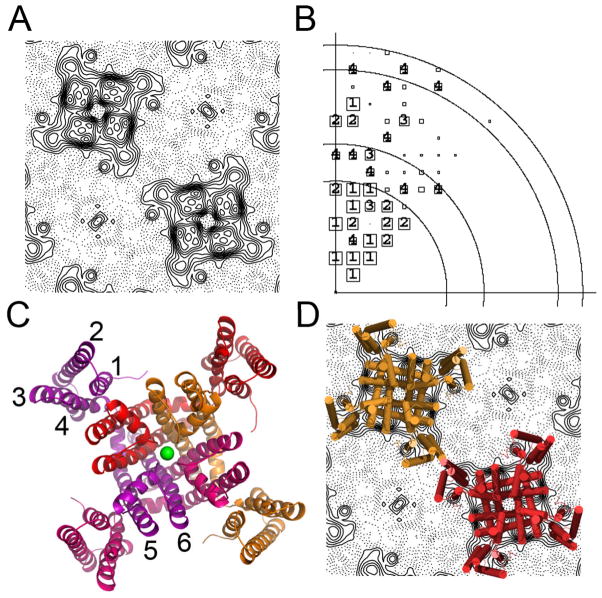
Figure 2. 2D and 3D structures.
A) Cryo-data projection of the MlotiK1 channel showing 2 channel molecules in the lattice. B) Phase error plot of cryo-data. Resolution circles: 20Å, 15Å, 10Å, 9Å; phase errors are encoded as follows: 1<8°, 2<14°, 3<20°, 4<30°, 5<40°, 6<50°, 7<80°, 8<90° where 90° is random. The size of the plot symbols depends on the error of the reflection, with categories 1–4 individually labelled. C) Ribbon representation of the structure of the MlotiK1 channel (PDB code: 3BEH), subunits are shown in different colours; green sphere represents a potassium ion bound in the selectivity filter. Transmembrane helices are labelled 1 to 6. D) Superposition of the X-ray structure onto the cryo-data projection.

