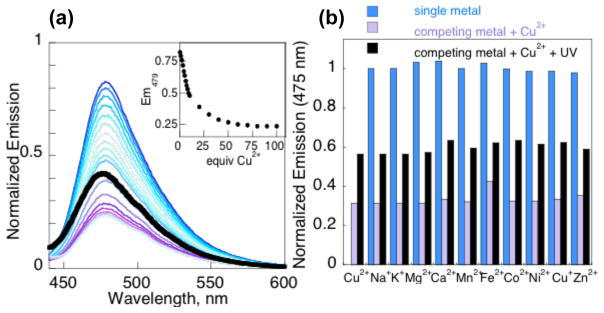
Figure 1.
a) Fluorescence decrease of 1 μM coucage with 0–100 equiv. Cu2+, along with the subsequent increase following UV exposure (thick black trace). Inset: Emission at 479 nm vs. added Cu2+. b) Blue bars: the unchanged fluorescence of 1 μM coucage in the presence of 1 mM Na+, K+, Mg2+, Ca2+ and Zn2+ or 50 μM for others; Purple bars: quenched emission upon addition of 50 μM Cu2+; black bars: restored fluorescence after 4 min of UV exposure. All samples prepared in 10 mM Hepes buffer at pH 7.4 with 10% DMSO and excited at 430 nm.

