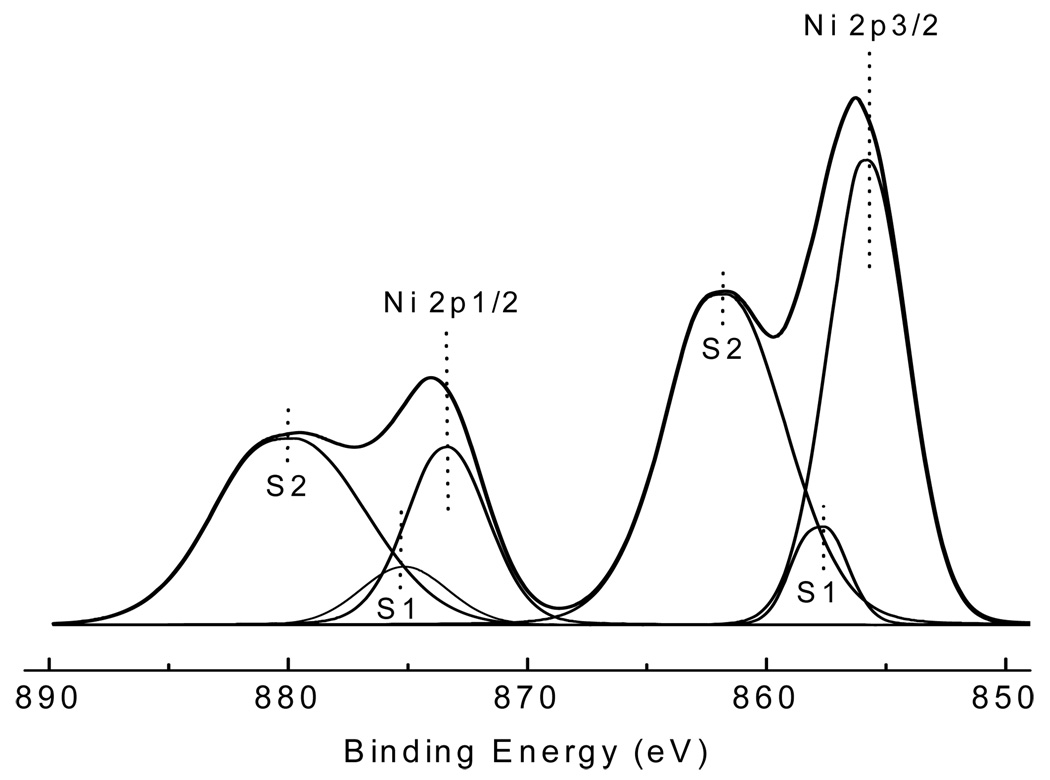
Figure 4.
Curve fitting of the Ni 2p spectrum from generated nano-Ni(OH)2. In the Ni 2p region, there are two main peaks 2p3/2 and 2p1/2; for each main peak, there are two shake-up satellite peaks S1 and S2. The peak positions and area percentages are shown in Table II.

