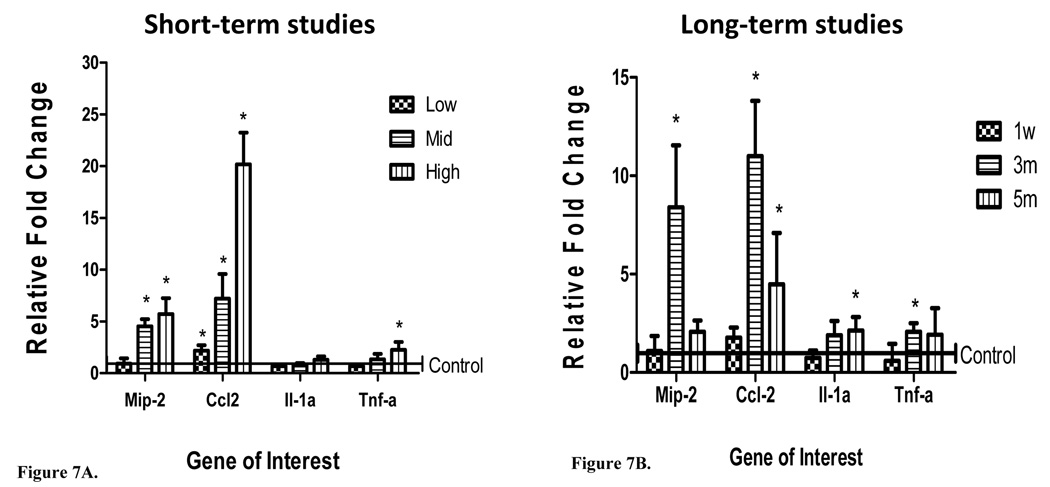
Figure 7.
mRNA expression of Mip-2, Ccl2, Il-1α, and Tnf-α in lavaged lung tissue of mice exposed to (A) low, mid, and high concentrations of nano-Ni(OH)2 (n = 3–4/group) and (B) 1 w, 3 m and 5 m of exposure to nano-Ni(OH)2 (n = 3–4/group). Concentrations for 1 w, 3 m, and 5 m exposures were 124.0, 129.3, and 124.5 µg/m3 (78.6, 82.0, 79.0 µg Ni/m3), respectively. Data are reported at 24 h post-exposure as a relative fold change over control (± SD) and asterisks indicate a statistically significant difference between nickel exposed and control groups as determined by student’s t-test (*P<0.05).

