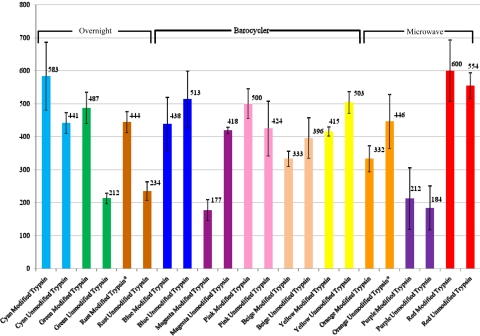
FIGURE 2.
Average number of proteins identified. This bar graph illustrates the average number of protein identification for all four replicates across all 22 protocols. The error bars in this figure represent plus and minus 1 sd from the mean. Replicates that were outside of 6 SD were removed and their respective groups have been marked with an asterisk.

