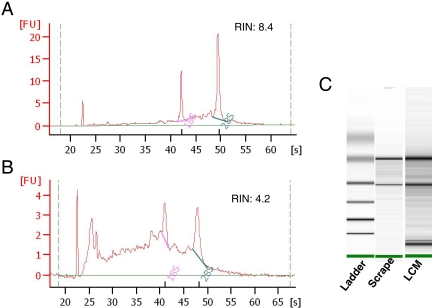
FIGURE 2.
RNA profile generated by Agilent Bioanalyzer. High-quality RNA was extracted from LCM-isolated cells. RNA size and quality were analyzed with the Agilent 2100 bioanalyzer. A pseudo gel image was created, and bands were sized and quantified. (A and B) The y-axes indicate fluorescence units (FU), and the x-axes indicate the length of the RNA in nucleotides. The peaks of 18S and 28S rRNA are clearly visible. Shown are the profiles of total RNA extracted from scrapes of the entire prostate section (A) and from LCM-isolated cells (B). (C) Gel electrophoresis analysis of the same RNA in A and B.

