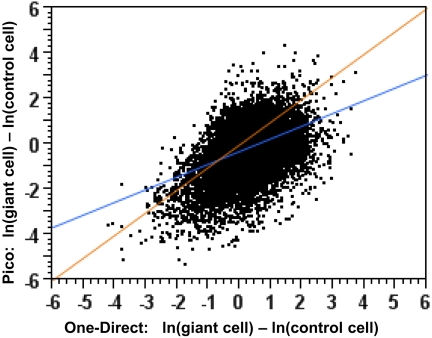
FIGURE 5.
Comparison of gene-expression measurements after Pico and One-Direct amplification. Scatter-plot with regression line (blue) of the difference between the natural log of the giant cell MAS5 signal and the natural log of the control cell MAS5 signal for Pico (y-axis) and One-Direct (x-axis). A 45° trend (perfect agreement) line is drawn in orange.

