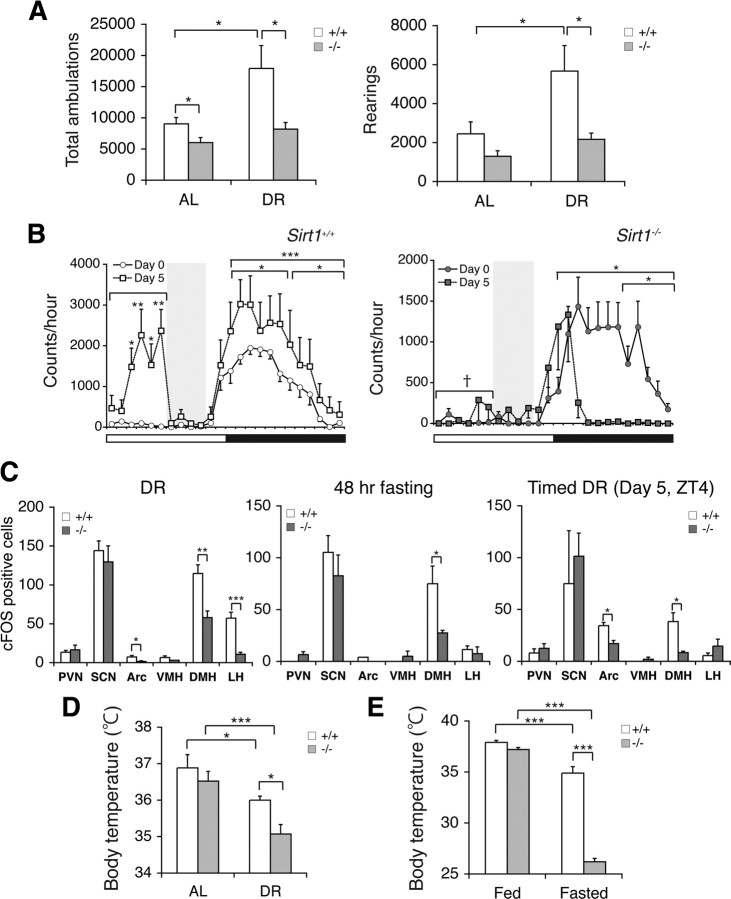
Figure 4.
Sirt1-deficient mice have defects in neurobehavioral adaptation to diet-restricting conditions. A, Numbers of total ambulations (left) and rearings (right) of Sirt1+/+ and Sirt1−/− mice under AL and 14 d DR conditions are shown as mean values ± SEM (*p < 0.05 by one-way ANOVA with Tukey–Kramer post hoc test, n = 5 mice). B, Wheel-running activity levels of Sirt1−/− and Sirt1+/+ mice during a timed DR paradigm. Activity counts per hour of control mice (left) and Sirt1−/− mice (right) through a 24 h light/dark cycle are shown. Shading represents feeding time (ZT6 to 10). Counts at each time point are shown as mean values ± SEM (day 0 vs day 5, *p < 0.05, **p < 0.01, ***p < 0.001 by paired Student's t or Wilcoxon matched-pairs signed-ranks tests; Sirt1+/+ vs Sirt1−/−, †p < 0.001 by a Wilcoxon matched-pairs signed-ranks test, n = 9 and 4 for Sirt1+/+ and Sirt1−/− mice, respectively). C, Quantification of the number of cFOS-positive cells in hypothalamic nuclei after 14 d DR (left), 48 h fasting (middle), and 5 d of timed DR (right) in Sirt1−/− mice (*p < 0.05, **p < 0.01, ***p < 0.001, n = 3 mice for DR and fasting, 6–9 sections per hypothalamic nucleus; n = 2 mice for timed DR, 2–7 sections per hypothalamic nucleus). The numbers of cFOS-positive cells are shown as mean values ± SEM. D, E, Rectal body temperature of Sirt1+/+ and Sirt1−/− mice during 14 d DR (D) and after 48 h fasting (E). Levels of rectal body temperature are shown as mean values ± SEM (*p < 0.05, ***p < 0.001 by one-way ANOVA with Tukey–Kramer post hoc test, n = 5–10 for 48 h fasting, n = 5 for DR).

