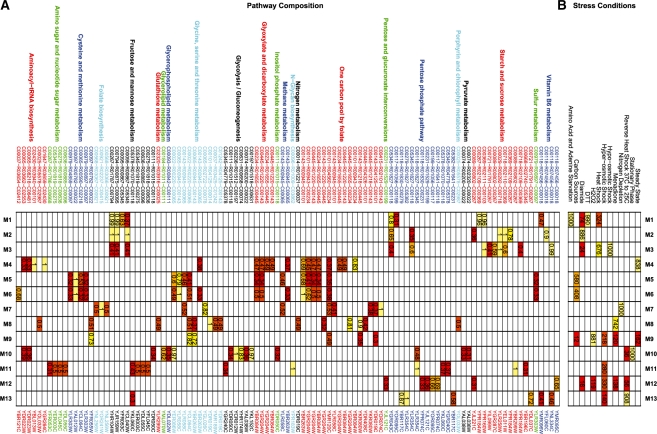
Fig. 3.
The 3M pathway clustering results for clustering yeast stress conditions. (A) Represents the cluster structure annotated by KEGG pathway, to compound, reaction, from compound on the top axis and gene on the bottom axis. (B) represents the confusion matrix between stress condition and cluster. Throughout both images yellow represent highly important cluster features and red represents less important features.

