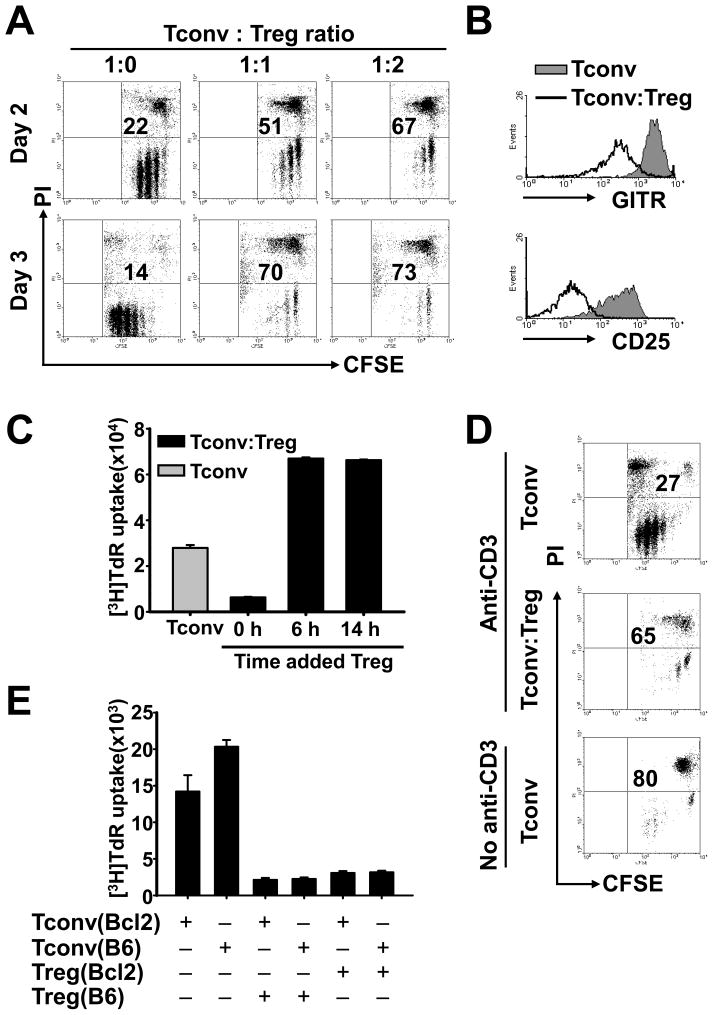
Figure 1. Similar suppressive effects by Tregs on naïve Tconvs and Bcl-2-over-expressing Tconvs but not on activated Tconvs.
Purified CD4+CD25− Tconvs were cultured without or with CD4+CD25+ Tregs at a 1:1 ratio (except in A). Syngeneic APCs and soluble anti-CD3 mAb were used as stimulators (except in D). In A, B, and D, Tconvs were CFSE-labeled before cultivation. (A) Dot plots show CFSE fluorescence vs. PI staining within the CFSE+ Tconv population at culture day 2 and day 3; Tconv:Treg ratios were indicated. Numbers represent the percentage of PI+ Tconvs. (B) Overlay histograms show the expression of GITR or CD25 on CFSE+PI− Tconvs in the day 2 cultures. The black line and the filled gray area represent Tconvs cultured with and without Tregs, respectively. (C) Tregs were added to cultures at the indicated time points. Cell proliferation was assessed on day 3 by 3H-thymidine incorporation. (D) APCs together with (top and middle panels) or without (bottom panel) anti-CD3 mAb were used as stimulators. Dot plots show the frequency of PI+ cells within the CFSE+ Tconv population in the day 3 cultures. (E) As indicated, Tconvs and Tregs isolated from Bcl-2 transgenic or wild-type B6 mice were cultured. Cell proliferation was assessed on day 3 by 3H-thymidine incorporation. More details are described in Materials and Methods. Figures are representative of 3 experiments.

