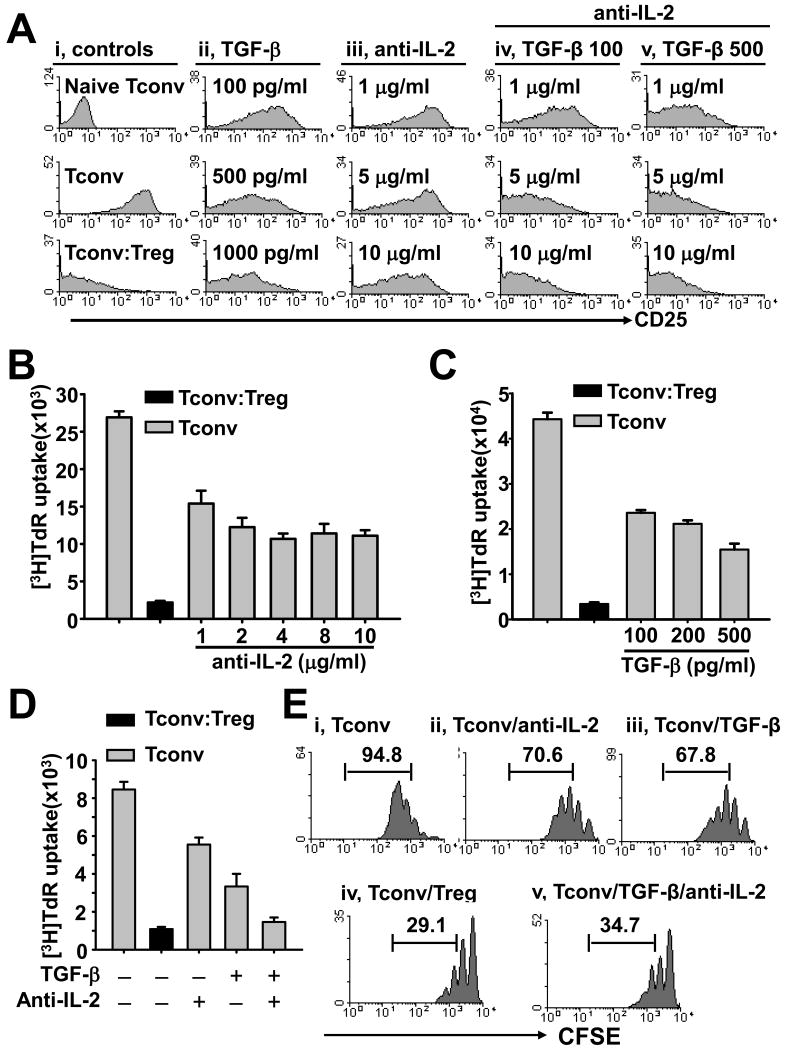
Figure 3. IL-2 deprivation cooperates with TGF-β to inhibit early activation and proliferation of Tconvs.
CD4+CD25− Tconvs were stimulated by APCs/anti-CD3 mAb. (A) Cultures of CFSE-labeled Tconvs were treated with various concentration of TGF-β (ii), neutralizing anti-IL-2 mAb (iii), or TGF-β (iv, 100 pg/ml; v, 500 pg/ml) together with various concentration anti-IL-2 mAb (as indicated). Tconvs were also cultured without treatment or co-cultured with Tregs at a 1:1 ratio (i, middle or bottom panel, respectively). Histograms show the expression of CD25 on CFSE+PI− Tconvs in the day 2 cultures, or on freshly isolated naïve Tconvs (i, top panel). (B-D) Cultures of Tconvs were treated without or with various concentration of anti-IL-2 mAb or TGF-β as indicated (gray bars). Tconvs co-cultured with Tregs were served as a control (black bars). In D, 500 pg/ml TGF-β and 10 μg/ml anti-IL-2 mAb were used. Cell proliferation was assessed on day 3 by 3H-thymidine incorporation. (E) Cultures of CFSE-labeled Tconvs were treated with anti-IL-2 mAb (ii, 10 μg/ml) or TGF-β (iii, 500 pg/ml), or anti-IL-2 mAb plus TGF-β (v). Tconvs cultured without treatment (i) or co-cultured with Tregs at a 1:1 ratio (iv) served as controls. Histograms show the CFSE fluorescence within the CFSE+PI− Tconv population in the day 3 cultures. Numbers represent the percentage of Tconvs that divided more than once. Figures are representative of 3 experiments.

