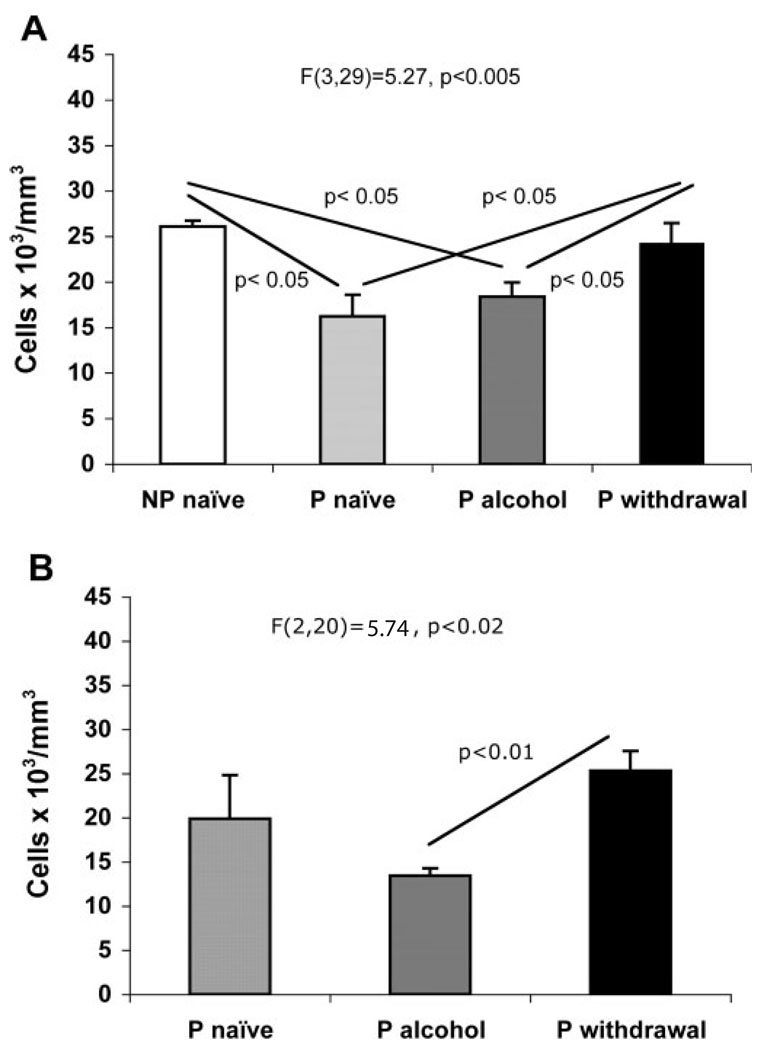
Fig. 3.
Graphs of the average packing density of GFAP-immunoreactive astrocytes in the prelimbic cortex of NP rats, alcohol naïve P rats, alcohol-drinking P rats, and alcohol drinking P rats with withdrawal after 2-month (A) or 6-month treatments (B). The experiment with 6-month exposure only included P rats. The identification of groups is as in Fig. 2. Whiskers represent the standard error of the mean.

