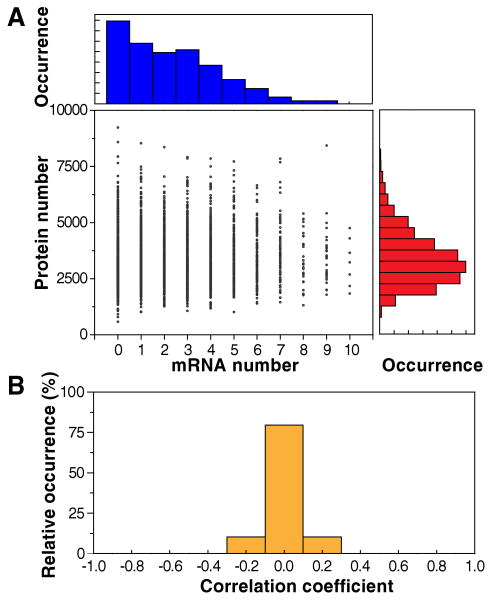
Figure 4.
No correlation between mRNA and protein levels in a single cell at a particular time. (A) Histograms of mRNA (top) and protein (right) levels. Protein vs. mRNA copy number plot for the TufA-YFP strain, in which TufA is tagged with YFP. Each point represents a single cell of the strain. Strikingly, the correlation coefficient is r = 0.01 ± 0.03 (mean ± SD, N = 5,447). (B) Histogram of correlation coefficients from 129 strains with highly expressed labeled genes whose sampling error for the correlation coefficient is <0.1. The histogram indicates that the lack of correlation between mRNA and protein levels in a single cell is a general phenomenon.

