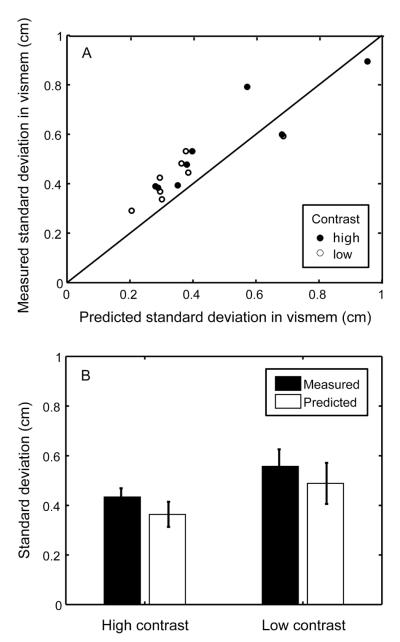
Figure 8.
(A) Scatter plot of the (corrected) variable error in subjects’ end-points in the vismem condition versus the variable error predicted by their variable error in the vis and mem conditions using equation (9); that is, assuming that all of the variable error was due to perceptual errors. (B) The average across subjects of subjects’ variable errors versus their predicted variable errors.

