
Figure 2.
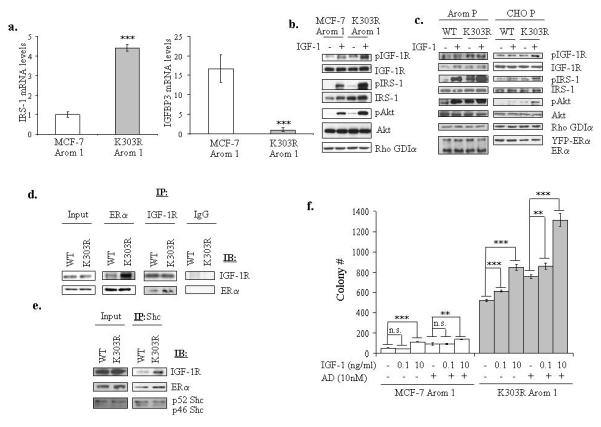
The K303R ERα mutant cells exhibited increased activation of the IGF-1 signaling pathway. (a) IRS-1 and IGFBP3 mRNA expression was assessed by quantitative real-time RT-PCR analysis. Each bar represents mRNA expression relative to β-actin mRNA (endogenous control gene) ± SD (average of four samples). ***P<0.0001 K303R-Arom 1 mRNA levels compared to MCF-7 Arom 1 (b, c) Serum-deprived MCF-7 Arom 1 and K303R Arom 1 cells (b) or MCF-7 WT, K303R P and CHO WT, K303R P (c) pools of stably transfected and overexpressing cells were treated with vehicle or IGF-1 10ng/ml for 5min. Total cellular extracts were analyzed for phosphorylation (p) and expression of IGF-1R, IRS-1 and Akt by immunoblot analysis. Rho GDIα was used as a control for equal loading and transfer. Immunoblots show a single representative of three separate experiments. (d, e) Lysates from CHO cells transiently transfected with WT or K303R ERα were immunoprecipitated (IP) with anti-ERα or IGF-1R or IgG (negative control) (d) or Shc (e) antibodies and immunoblotted for IGF-1R, ERα or Shc. (f) Cells were plated in soft agar, and then treated with vehicle (−) or increasing amounts of IGF-1 (0.1 and 10ng/ml) ± AD 10nM. Cells were allowed to grow for 14 days, and the number of colonies >50μm were quantified, and the results were graphed. Data are the mean colony number of three plates and representative of two independent experiments. Bars, SD. n.s.=nonsignificant, **P<0.01, ***P<0.0005.