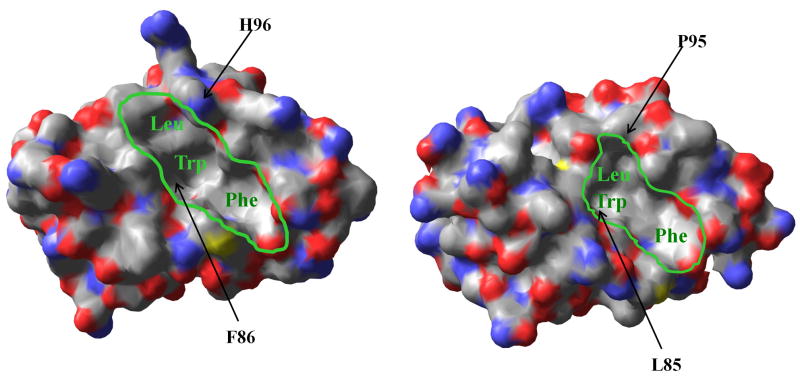
Figure 5.
Surface representations of Hdm2 (PDB: 1YCR; left) and Hdmx (PDB: 3DAB; right) in bound states with ligands (p53 residues 15–29) not shown for clarity. The proteins are colored according to the elemental make-up (C = grey, O = red, N = blue, S = yellow). The p53-binding pockets with labeled Leu, Trp and Phe subsites (green) are outlined to highlight the topological differences in the respective binding pockets. The residues proposed to be responsible for differences in ligand recognition patterns (F86 and H96 in Hdm2; L85 and P95 in Hdmx) are indicated by arrows.

