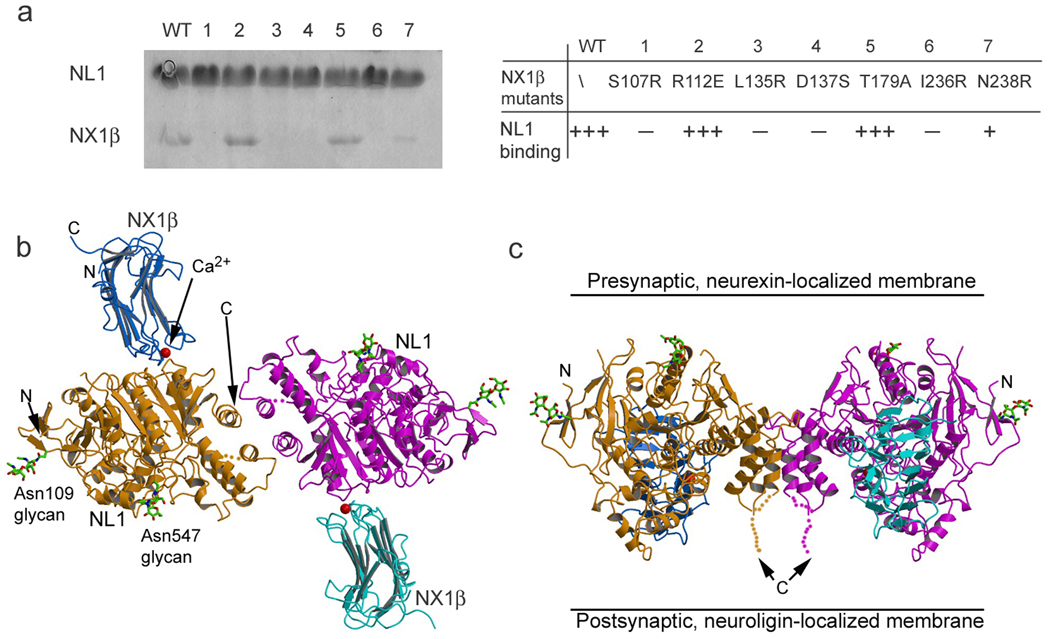
Figure 1. Structure of the NL1-NX1β complex.
(a) His-tag pulldown assay showing effects of mutagenesis of NX1β surface residues on NL1 binding. The gel is Coomassie-stained SDS-PAGE, with upper bands being His-tagged NL1 attached to Ni-NTA resin, and lower bands being non-His-tagged NX1β mutants retained by NL1. (b) The 2:2 NL1-NX1β complex in ribbons model, viewed from the direction of NX1β-localized membrane. NL1 is colored in orange and pink, NX1β in blue and cyan. Ca2+ ions are depicted as red balls. (c) The complex viewed from the side.

