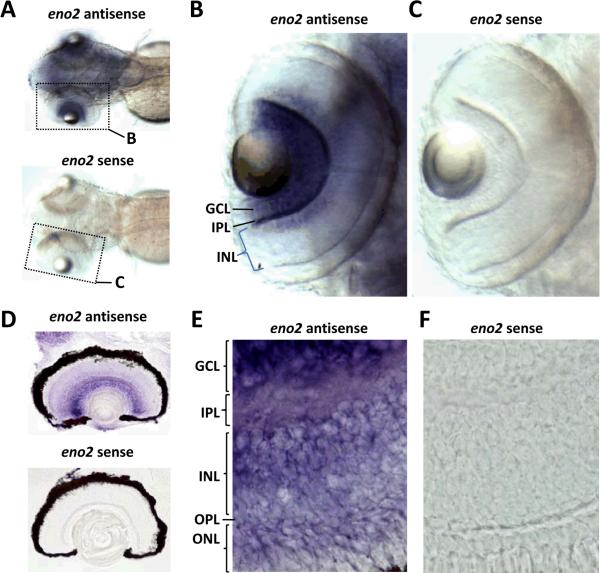
Figure 1. Expression of endogenous eno2 in the retina.
RNA in situ hybridization was employed in order to analyze endogenous eno2 mRNA expression in the retina at 72 hpf (A–C) and 12 dpf (D–F)
A–C: Panel A shows a low power superior view of two whole mount 72hpf larvae (rostral left) that were hybridized with a cRNA probe specific to eno2 (upper larva) or a sense control probe (lower larva). Hybridized probe was detected using a histochemical reaction with a purple/blue reaction product. The region of each image encompassing the left eye is shown at higher magnification in panels B and C, as indicated by the dotted outline.
D–F: Panel D shows a low power view of two 15μm cryosections of eyes from 12dpf larvae that were hybridized with cRNA probe specific to eno2 (upper sample) or a control sense probe (lower sample). Hybridized probe was detected with a histochemical reaction producing a purple/blue product. Representative high magnification fields from similar sections are shown in panels E and F. Key: GCL, ganglion cell layer; IPL, inner plexiform layer; INL, inner nuclear layer; OPL, outer plexiform layer; ONL, outer nuclear layer

