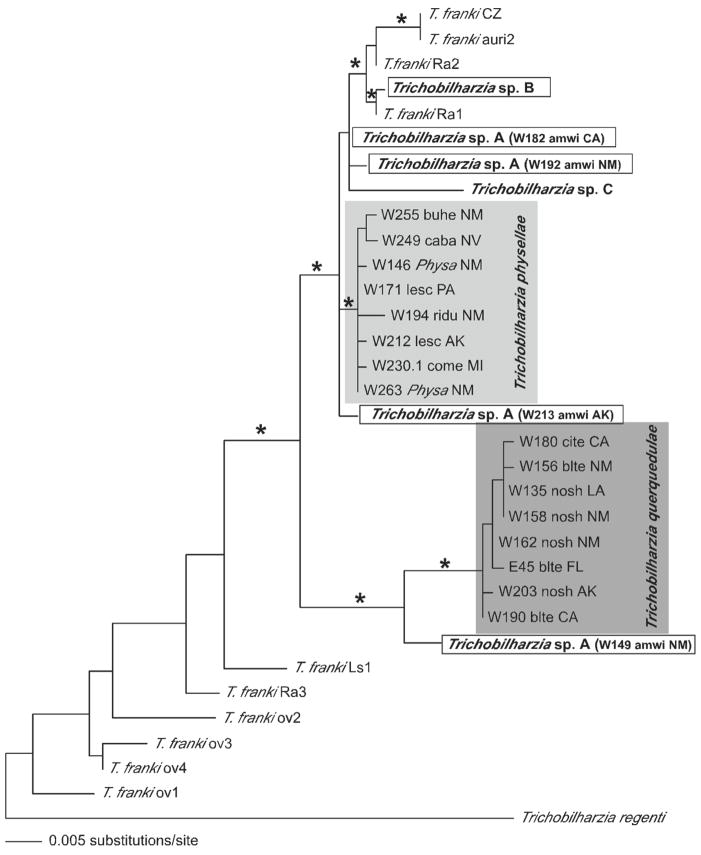
FIGURE 6.
Maximum likelihood tree based on ITS1 sequences of an expanded Clade Q. Trichobilharzia A is boxed to show its variable position in the tree and paraphyly of T. franki. Isolates of T. franki are from R. ovata (ov) and R. auricularia (Ra) snails (one sample is from Lymnaea stagnalis = Ls). See Table III for label descriptions. The “*” indicates node support of >95% bootstrap for MP and ME and >98 Bayesian PP. The ‘-’ indicates no significant node support.

