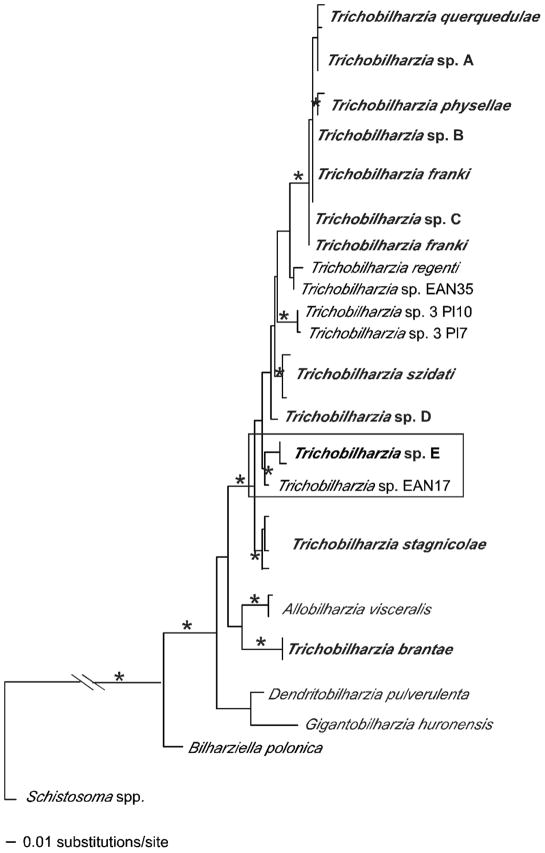
FIGURE 7.
Maximum likelihood tree based on ITS2 sequences showing the positions of the unidentified avian schistosome isolates from GenBank. The boxed clade highlights the relationship between the samples from North America and France. Bolded samples indicate those from this study. See Table III for label descriptions. The “*” indicates node support of >95% bootstrap for MP and ME and >98 Bayesian PP. The ‘-’ indicates no significant node support.

