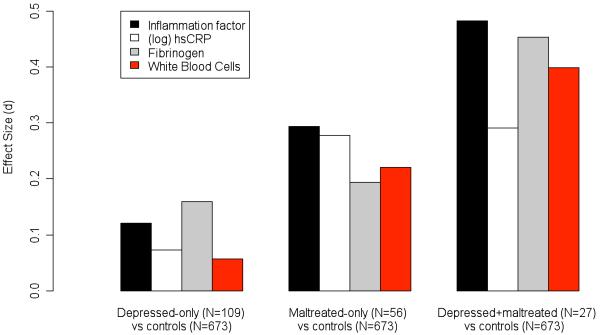
FIGURE 1.
Differences in effect size (Cohen’s d) units resulting from a priori defined contrasts between controls and other study groups. Effect sizes are commonly interpreted as small when equal to 0.2, moderate when equal to 0.5, and large when equal to 0.8. The “depressed-only individuals versus controls” contrast showed effect sizes of d=0.12 for the inflammation factor, d=0.07 for (log) hsCRP, d=0.16 for fibrinogen, and d=0.06 for white blood cells (WBC). The “maltreated-only individuals versus controls” contrast showed effect sizes of d=0.29 for the inflammation factor, d=0.28 for (log) hsCRP, d=0.19 for fibrinogen, and d=0.22 for WBC. The “depressed+maltreated individuals versus controls” contrast showed effect sizes of d=0.48 for the inflammation factor, d=0.29 for (log) hsCRP, d=0.45 for fibrinogen, and d=0.40 for WBC.

