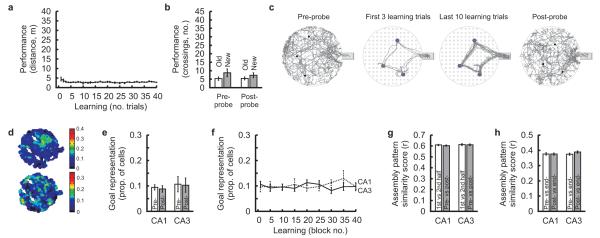
Figure 3. Locating rewards during the Cued version of the cheeseboard maze task.
(a-c) Learning performance was estimated by the distance travelled to find all 3 rewards per trial (a, means±s.e.m, P>0.209, ANOVA). Memory performance was estimated by the number of crossings in goal areas during probe sessions (b, means±s.e.m; see Methods and also Supplementary Fig. 2b). Crossings were compared for locations learnt the day before (“Old”) and the current day (“New”; all Ps>0.185, paired t-test). Representative examples of animal’s path (c; small black dots: goal locations; grey-filled circles: intra-maze cues); for the probes, only the first 10 min are depicted for clarity. Note that animals followed similarly efficient movement paths during the cued learning as they had in the absence of intra-maze cues (see Figure 1c).
(d) Color-coded maps illustrating the post-probe spatial distribution of CA1 place fields. Pixel color represents the proportion of cells with place fields center at that x-y location (z scale=proportion of cells fire >80% of peak firing rate at that location). The white arrows indicate the learnt bait-locations.
(e-f) Proportion of place cells representing bait-locations (means±s.e.m; see Methods) during probe sessions (e, pre- compared to post-: all Ps>0.692, paired t-test) and across trials (f, CA1: solid line, CA3: dashed line, all Ps>0.785, ANOVA). The proportion of cells were calculated separately for each recording day and averaged. Note that the proportion did not change during the cued learning.
(g-h) Assembly patterns similarity score (means±s.e.m.) determined using a population vector analysis (see Methods) within probe (g, 1st versus 2nd half), between probes (g, pre- versus post-; 1st versus 2nd half compared to pre- versus post-: all Ps>0.401, paired t-test), and between each probe and end of learning (h, pre-/post- versus end-; pre- versus end- compared to post- versus end-: all Ps>0.122, paired t-test). Note that hippocampal assemblies remained similar in all three periods.
pre-: pre-probe, post-: post-probe, end-: end of learning.

