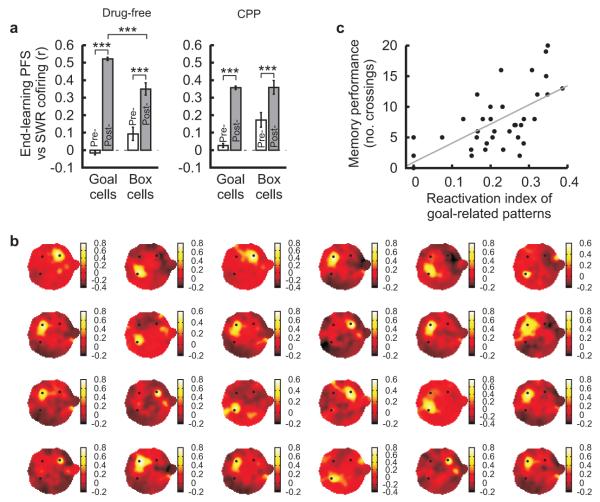
Figure 5. Reactivation of CA1 place-related assembly patterns.
(a) Correlation between place field similarity (“PFS”) and sSWR cofiring calculated for “goal-centric” and “start-box” cell pairs (means±s.e.m, ***: P<0.001, paired t-test). The PFS was calculated using place fields established at the end of learning while sSWR cofiring was calculated in rest periods before (“pre-”) and after (“post-”) learning. Correlation coefficients represent the partial correlations of the PFS with the cofiring of one rest session, each controlled by the cofiring of the other rest session (see Methods).
(b) Representative examples of individual sSWR reactivation maps (black dots: learnt goal locations). For each map, the pixel color represents the correlation coefficient between assembly firing patterns that occurred during a single sSWR and those representing that x-y location on the maze during the waking period (see Methods). Note that correlation coefficients are highest at one of the bait-locations (z scale: correlation coefficient).
(c) Scatter plot showing post-probe memory performance (number of crossings at a given goal location) as a function of the proportion of sSWRs in which assembly patterns represented the same goal location (in grey: regression line, r=0.620, P=0.00005).

