
Figure 5. Atg16L1 vesicles co-localise with cholera toxin-subunit B-labelled vesicles.
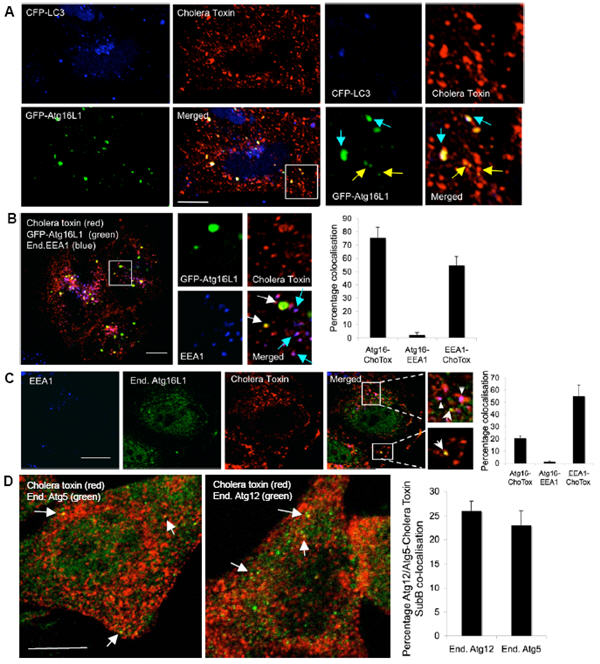
A. HeLa cells transfected for 24 h with GFP-Atg16L1 (green) and CFP-LC3 (blue) were incubated with Alexa fluor-555-conjugated cholera toxin-subunit B (red) for 15 minutes at 4°C (allowing toxin binding to the plasma membrane). Then cells were incubated at 37°C (which allows cholera toxin internalization) for 10 minutes and fixed for confocal analysis. Vesicles positive for Atg16L1 and cholera toxin are yellow (also see high magnification images). Note that the small Atg16L1 vesicles co-localising with cholera toxin are negative for LC3 (as marked with yellow arrows) and the Atg16L1 vesicles co-localising both with cholera toxin and LC3 (marked with blue arrows) are shown in the magnified panels on the right. Scale bar – 10 μm. B. HeLa cells transfected for 24 h with GFP-Atg16L1 (green) were incubated with Alexa fluor-555-conjugated cholera toxin-subunit B (red) as in A after which they were fixed, immunostained for endogenous EEA1 (blue) and analysed by confocal microscopy. Vesicles positive for Atg16L1 and cholera toxin B are yellow (white arrows) and vesicles positive for both EEA1 and cholera toxin are purple (blue arrows) and is shown in the high magnification images. Graph shows percentage co-localisation. n = 20 cells. Scale bar – 10 μm. C. HeLa cells treated with HBSS for 6 h were incubated Alexa fluor-555-labelled cholera toxin-subunit B (red) as in A. Cells were then fixed, and immunostained for endogenous Atg16L1 (green) and endogenous EEA1 (blue). Cells were analysed as in B and graph shows quantitation. Scale bar – 10 μm. Arrows show Atg16L1-cholera toxin co-localisation. Triangles show EEA1-cholera toxin co-localisation. n = 20 cells. D. HeLa cells treated with HBSS for 6 h were incubated with Alexa fluor-555-labelled cholera toxin-subunit B (red) as in A. Cells were then fixed and immunostained for endogenous Atg5 (green) or endogenous Atg12 (green). Co-localisation of the Atg5 (n = 18 cells) or Atg12 vesicles (n = 39 cells) with cholera toxin is shown in yellow (arrows) and quantitated in graph. Scale bar – 10 μm. All error bars in the graphs represent SEM.