
Figure 7. Plasma membrane contributes to Atg16L1-positive autophagosome precursors.
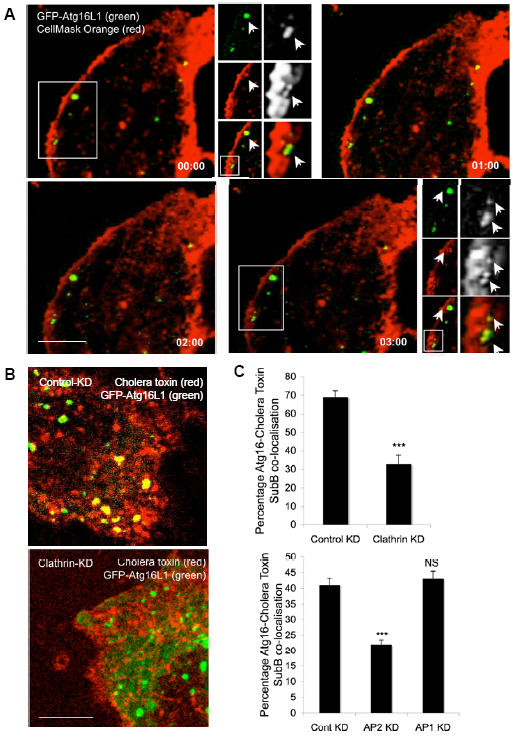
A. HeLa cells transfected for 24 h with GFP-Atg16L1 (green) were incubated with CellMask orange plasma membrane stain for 5 minutes at 37°C, after which they were then imaged immediately (in an incubated chamber at 37°C). A time series following fusion of a CellMask orange vesicle (red) with GFP-Atg16L1 vesicle (green) is shown. Scale bar – 5 μm. A higher magnification image showing co-localisation (yellow) of GFP-Atg16L1 vesicle (green) with CellMask orange-positive vesicle (red), that are marked by arrows is also shown in the top and bottom panels. B, C. HeLa cells transfected with control, clathrin-heavy chain, AP1 or AP2 siRNA for 72 h were subsequently transfected with GFP-Atg16L1 (green) together with the siRNA for the next 24 h. The cells were then incubated with Alexa fluor-555-conjugated cholera toxin-subunit B (red) for 15 minutes at 4°C, followed by further incubation at 37°C for 10 minutes, after which the cells were fixed for confocal analysis. The co-localisation (yellow) of GFP-Atg16L1 (green) with cholera toxin (red) in control or clathrin-heavy chain knockdown is shown, which is quantitated in the graph in C. n = 25 cells. *** - p=0.0002 for clathrin-heavy chain KD and <0.0001 for AP2 KD. All error bars in the graphs represent SEM. Scale bar – 5 μm.