Figure 5.
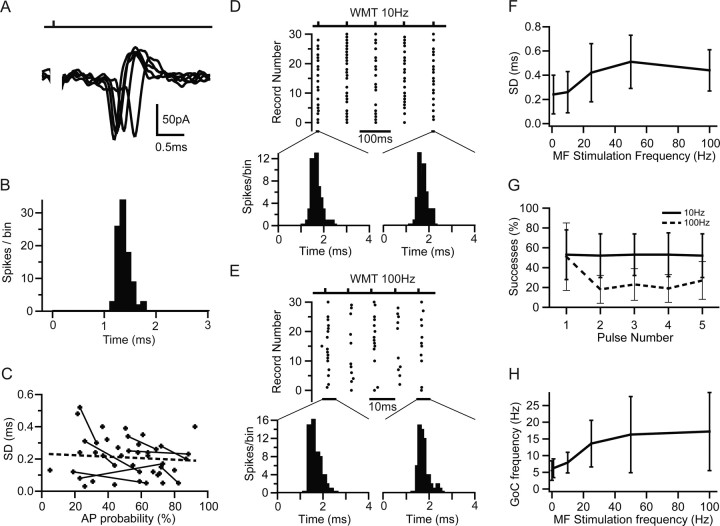
Precision and reliability of mossy fiber-evoked Golgi cell firing. A, MF-evoked APs recorded in LCA configuration at high temporal resolution. B, Spike latency histogram of APs during 1 Hz stimulation measured over a 3 ms window after the stimulus. C, Dependence of SD of AP times (precision) on AP probability for LCA recordings. Data points connected with lines show the AP precision at two different AP probabilities (stimulus intensities) for the same cell. Broken line indicates linear regression of all data points (Pearson's r = −0.14; p > 0.2). D, Spike raster plot showing Golgi cell firing in response to 10 Hz white matter tract stimulation. The distributions shown below illustrate the spike jitter for APs in response to the first and fifth stimulus (4 ms measurement window). E, Same as D for 100 Hz stimulation. F, Dependence of spike-time precision on stimulation frequency across cells. Spike-time precision deteriorates slightly but significantly with increasing input frequency (n = 5). G, Probability of generating MF-evoked spikes in Golgi cells during trains of five stimuli at 10 Hz (solid line) and 100 Hz (dashed line). H, Effect of MF stimulation frequency on Golgi cell mean firing rate. The moderate increase in firing rate was significant for stimulation frequencies ≥10 Hz (p < 0.05, pairwise t test).

