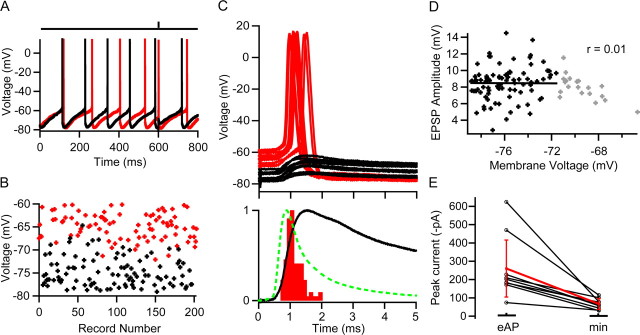
Figure 6.
EPSP-spike coupling and efficacy of mossy fiber–Golgi cell transmission. A, Whole-cell current-clamp recordings from a Golgi cell exhibiting spontaneous rhythmic firing and pronounced afterhyperpolarization. The bar above indicates the timing of MF stimulation, which triggered an AP on one trial (red) but failed to cross threshold on the other (black). The stimulus intensity was set to give a 50% AP probability, which was determined in a previous LCA recording of the same cell. B, Membrane voltage during a 500 μs time window before the synaptic event. When MF EPSPs occurred late in the spike cycle at depolarized membrane potentials, they tended to trigger APs (red), but when membrane voltage was hyperpolarized, EPSPs remained subthreshold (black). C, Top, MF-evoked APs (red) and subthreshold EPSPs (black) for same cell on expanded scale. Bottom, Overlay of peak normalized spike latency histogram measured over 5 ms time window after the stimulus (red) and corresponding mean subthreshold EPSP (black) from the same cell. Latency was measured as the time between the stimulus and threshold crossing. The population mean EPSC waveform (dashed green line; 9 cells recorded with a different amplifier) (see Materials and Methods) was aligned to the foot of the uncompensated EPSC recorded in this cell. The fact that the peak of the EPSC and maximum rate of rise of the EPSP occur at the same time suggests that this alignment is correct. D, Dependence of EPSC amplitude on preceding membrane potential for subthreshold EPSPs. A linear regression was only fit to EPSP measurements with preceding potentials below −72 mV (black points) to avoid the sampling bias caused by the loss of EPSPs that generated APs from the population. The remaining EPSP measurements are shown in gray. E, Average amplitudes of mossy fiber EPSCs recorded at stimulus voltages that evoked APs (eAP) with 50% probability and EPSC amplitudes evoked with minimal stimulation (min) in the same cells.

