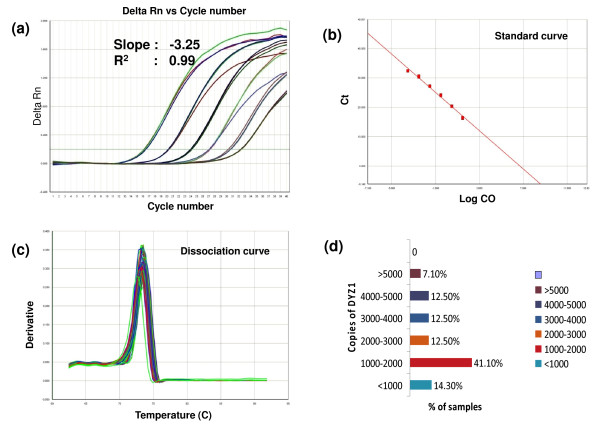
Figure 6.
Copy number assessment of DYZ1 per genome. a represents the amplification plot while b and c show the corresponding standard plot and dissociation curve respectively. d shows the distribution of copy number variation of DYZ1 arrays across the exposed samples based on real time analysis. As clearly evident, 41% of samples have between 1000-2000 copies while 14% samples had less than thousand copies. Contrastingly, all the unexposed samples from Delhi had copies ranging from 3800 to 4200.

