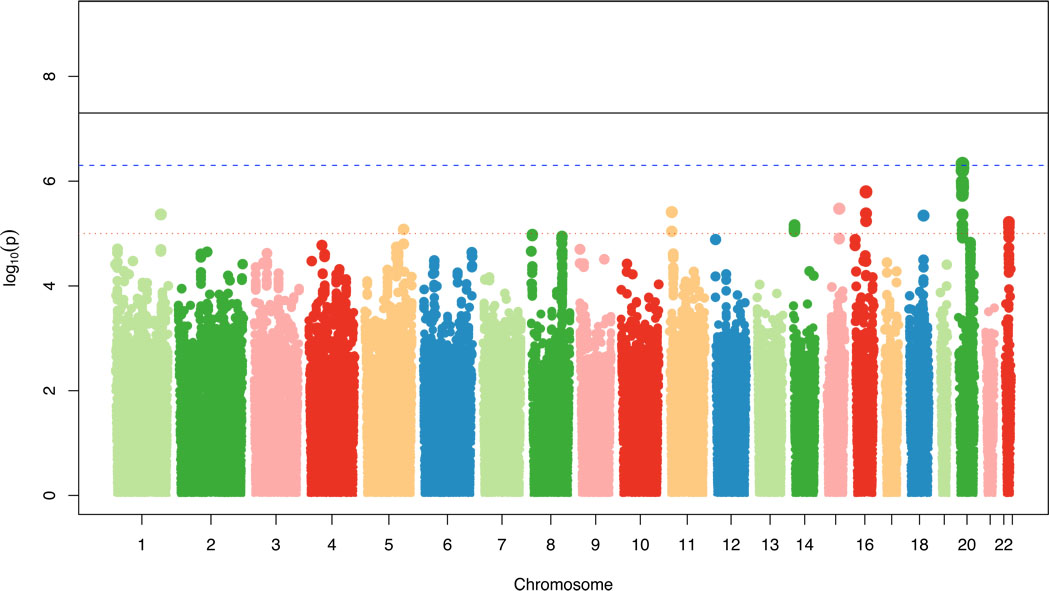
Figure 1.
Genome-wide signal intensity (Manhattan) plot showing individual p-values against their genomic position for covert MRI-defined brain infarcts. Within each chromosome (x-axis), results are plotted left to right from p-terminal end. Solid black line indicates preset threshold for genome-wide significance, p=5.0×10⁻⁸; dashed blue line, more liberal threshold for genome-wide significance also used in the literature, p=5.0×10⁻⁷; dotted red line, threshold for highly suggestive associations, p=1.0×10⁻⁵.

