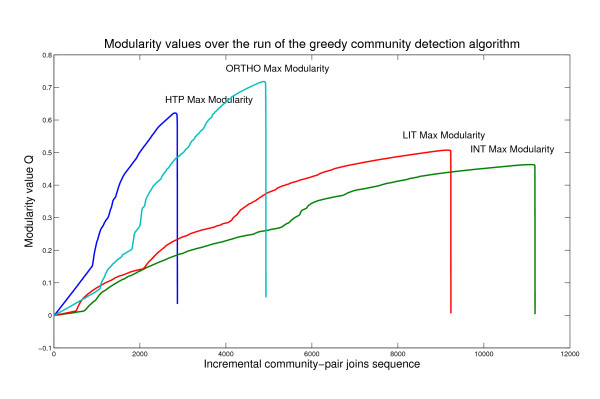
Figure 1.
MaxMod Patterns. Comparative MaxMod performance for the set of interactions networks studied: in agreement with known studies, values approximately ranging in 0.3 - 0.7 suggest modular structure. Software freely available through R -igraph package, fastgreedy.community function- then plotted from Matlab.

