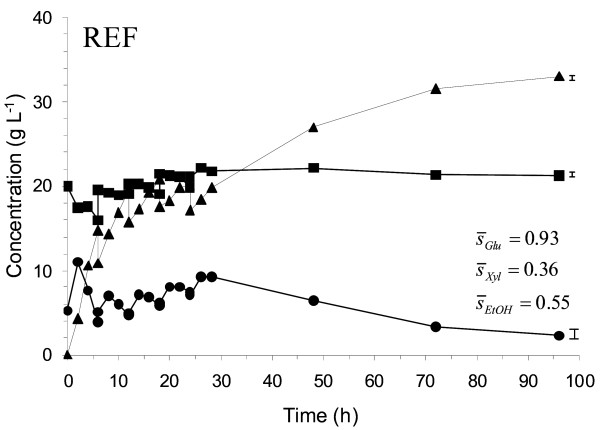
Figure 1.
Measured concentrations during duplicate reference fed-batch simultaneous saccharification and co-fermentation (SSCF) of wheat straw (8%-11% WIS) showing glucose (black circle), xylose (black square) and ethanol (black triangle). No enzyme feed was used; all enzymes were added initially. The mean standard deviation ( ) is given for the concentration profile and illustrated graphically at the right end of each profile.

