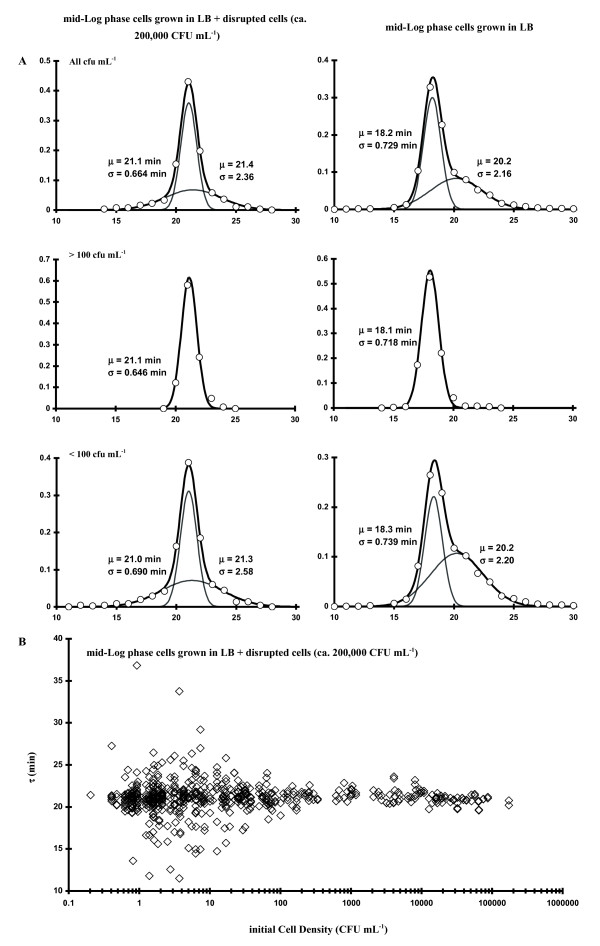
Figure 7.
A: Frequency of occurrence of various values of τ (all CI; CI > 100; CI < 100 CFU mL-1, from top to bottom). Left-hand side plots: mid-log phase cells diluted with and grown in LB with ~2×10⁵ CFU mL-1 of disrupted cells LB. Right-hand side plots: mid-Log phase cells diluted with and grown in LB. B:Plot of 572 observations of τ as a function of initial cell concentration (CI; diluted with and grown in LB with ~ 2×10⁵ CFU mL-1 of disrupted E. coli cells LB).

