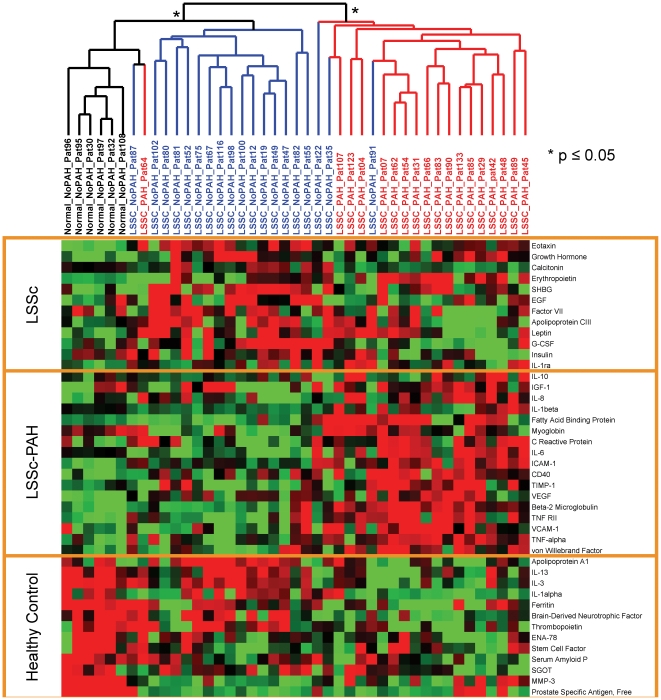
Figure 5. A subset of cytokines shows association with lSSc and lSSc-PAH.
A MAP panel was used to profile the cytokines in plasma from lSSc-PAH, lSSc-NoPAH, and healthy control samples. Cytokines with significantly different levels between the three groups were selected using a multiclass SAM analysis (FDR<4.93%). 42 cytokines were selected and organized by 2 dimensional hierarchical clustering. The dendrogram shows lSSc-PAH (red), lSSc-NoPAH (blue), and healthy controls (black) group distinctly. Asterisks indicate stable groups as determined by SigClust. Increasing brightness of red indicates relative fold change increase in cytokine levels. Increasing brightness for green pixels indicates decreasing cytokine levels. Yellow boxes highlight the cytokines with increased levels in the three major groups, lSSc-PAH, lSSc regardless of PAH status, and healthy controls.

