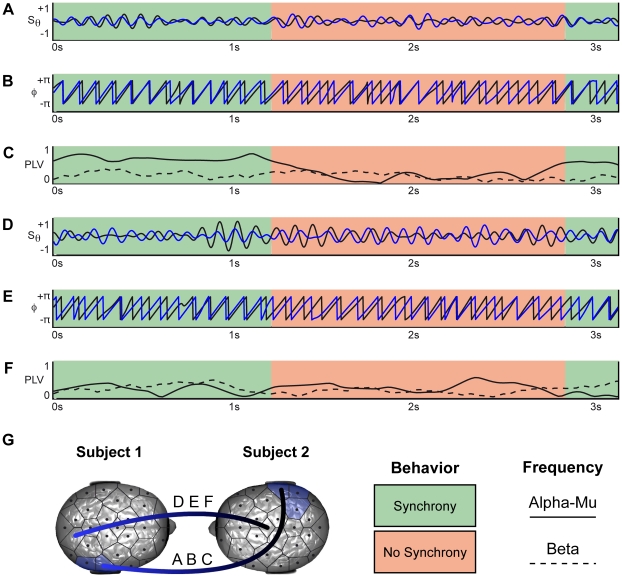
Figure 3. Brain synchronization: online example.
Samples of spontaneous imitation episodes in the dyad n°3 showing the correspondence between interactional synchrony and brain activities. The green areas indicate periods where subjects were behaviorally synchronized and the red ones periods without behavioral synchrony. A. Time course of normalized EEG signal filtered in the alpha-mu frequency band for the channels P8 of both subjects. These channels are members of the cluster shown in figure 2A. B. Phase extracted from the signals. C. PLV calculated with sliding centred time windows of 800ms length in the alpha-mu band (related to A and B) quantifying the neural synchronization between the two subjects. Beta band PLV for the same electrodes is also shown in dashed line. D. Time course of normalized EEG signal filtered in alpha-mu frequency band for the channels PO2 in Subject 1 and Cz in Subject 2. Those channels are not members of any clusters. E. Phase extracted from the signals. F. PLV calculated with sliding centred time windows of 800ms length in the alpha-mu band (related to D and E) quantifying the neural synchronization between the two subjects. Beta band PLV for the same electrodes is also shown in dashed line. G Representation of the pairs of electrodes P8-P8 (A,B,C) and PO2-Cz (D,E,F).

