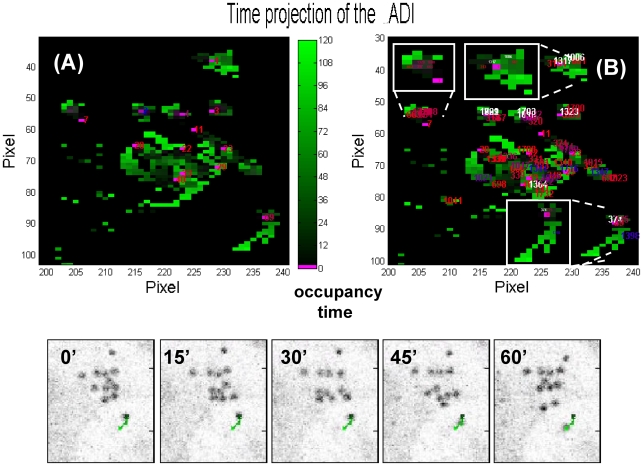
Figure 2. Targets' numbering on the ADI images.
Panel A. Result of the superposition of the ADI images with color coding (from dark to light green) for the occupancy time of each pixel. The original time stack (scan1.rar) can be downloaded from the site http://moby.mib.infn.it/~chirico/tracking.html as multi-tiff file. The original image corresponds to the frame ‘0’ reported on the bottom row of the figure. The targets segmented (the threshold parameter in A:image_filters.m is soglia = 0.022) on the first image of the stack were tracked through only the first 120 frames of the total 264 of this stack for display purposes. In this case the number of segmented images is 120 (parameter “numero” in the code), the parameter incrementostep was set to incrementostep = 121. The color code indicates the time at which a pixel was occupied in the individual ADI images according to the increasing green level (from dark to light green; the magenta pixels indicate the target position detected on the first image). Only those trajectories longer than 3 frames have been reported (parameters “lunghezza” and “length_traj” = 3 in C_coord_vector.m and D_beta_add_label.m, respectively). Image B. The same as in Image A but all the targets segmented on every 20 images along the stack (incrementostep = 20) have been tracked. The different colors of the target numbers (from red to purple) corresponds to the frames on which the specific target has first been segmented. The white colored text corresponds to those indices that were displaced by at most one pixel since they otherwise superimposed on other indices (see also the Supporting Information S1). The white framed boxes in the image report the zoom of three regions with high density of segmented targets. Notice that the text size is not rescaled while zooming, therefore making difficult to discern the exact position of a target in the original size image (see also the Supporting Information S1; section “Important notes on the color coding”). Bottom row images: frames from the original time stack after 0′, 15′, 30′, 45′ and 60′ superimposed with the reconstructed trajectory (green trace on the gray images) of the target number 69 (panel A). The color bar for the trajectory color coding is displayed between panel A and B and refer to all the images The corresponding movie, Movie S1, can be found on the SI and at the site http://moby.mib.infn.it/~chirico/tracking.html.

