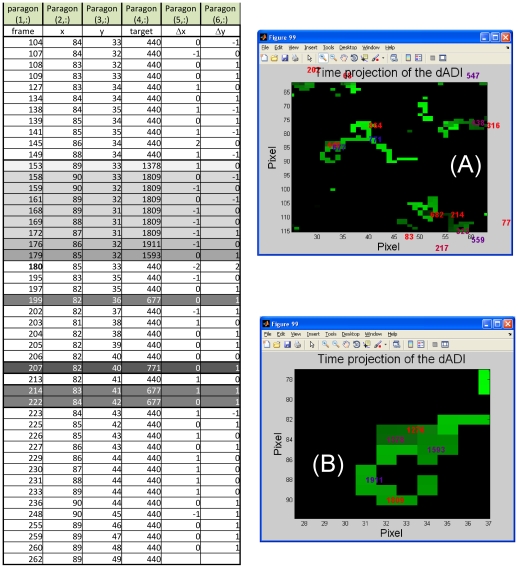
Figure 4. Construction of the trajectory in the case of entanglement.
Example of the use of the output (the table paragon) of the I phase of the algorithm (I_Create_Cross_Matrix.m) for the construction of the trajectory in the case of entanglement. The trajectory taken here as an example presents a loop that can be split in several subtrajectories depending on the incrementostep variable (panel A, incrementostep = 30 frames; panel B, incrementostep = 10 frames). The table reports the final assembling of the trajectory: different colors refer to different targets that are also reported in the panels A and B. In the table the entries are: the frame number, the x and y position in pixels, the target number and the differences between adjacent x and y positions, indicated as Dx and Dy. The corresponding movie of the lymphocyte motion is reported in the SI (the Movie S3).

