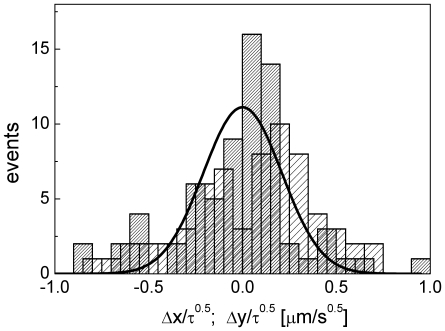
Figure 6. Statistical analysis of the intracellular diffusion of particles.
Distribution of the x (sparse pattern) and y (dense pattern) displacements normalized to the square root of the lag time between frames measured on a time series of images of cSLN particles in epithelial cells. Only subsequent detection of the particles have been selected in the analysis. The solid lines are Gaussian functions,  , globally fit to both the data sets. The common (globally fitted to the x- and y- displacements) best fit diffusion coefficient of the cSLNs is D = 0.022±0.01 µm2/s. We have employed the non linear least square (Levenberg-Marquardt) fitting routine of Origin 7.0 (OriginLab Corp.) with statistical (Poisson) weight on the data.

