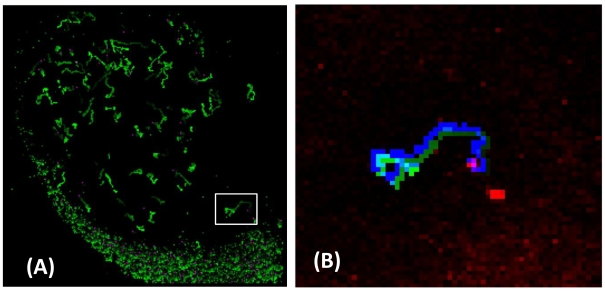
Figure 7. Analysis of lymphocytes trajectories within a ex-vivo lymphonodes kept in physiological conditions.
Panels A reports a wide field (256×256 pixels, 2.76 µm pixel size, FOV = 706×706 µm2) of the first image of a section of the lymphonodes (LN) together with the trajectories of all the targets that have been segmented. All the images were obtained by z-projection of the experimental volume. The trajectories were recovered by a 2D search on the projected volumes. In the trajectories the experimental time is coded by increasing green levels. Panel B shows a blow-up of the first image of the time series together with the trajectory of one of the visible lymphocytes obtained by the algorithm (the experiment time is coded as increasing green levels and a small shift is applied to the image for display purposes) and of the same lymphocyte as obtained by Volocity (plain blue curve). The resting lymphocytes are coded in red in the image. A white framed square in panel A indicates the position of the trajectory whose blow-up is given in panel B.

