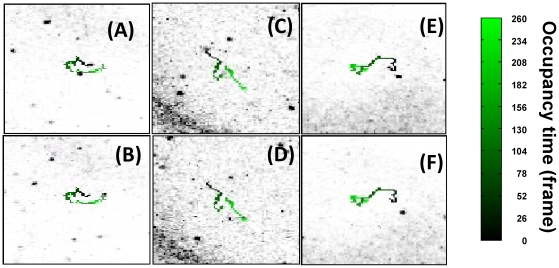
Figure 8. Example of lymphocytes tracking within an ex-vivo lymphonodes imaged under two-photon excitation (λexc = 800 nm).
Panels A to F report the first (A, C and E) and the last (B, D and F) images (FOV = 230×230 µm2) of the time series and the corresponding superimposed trajectories in which the experiment time is encoded as green levels as outlined by the reported colormap. These trajectories (reported here in increasing gray levels) have been reconstructed by following the targets segmented only on the first image on the time stack. The LUT of the images have been inverted with respect to Fig. 7 for display purposes. The movies that correspond to these frames are reported in the SI (Movies S7, S8 and S9).

