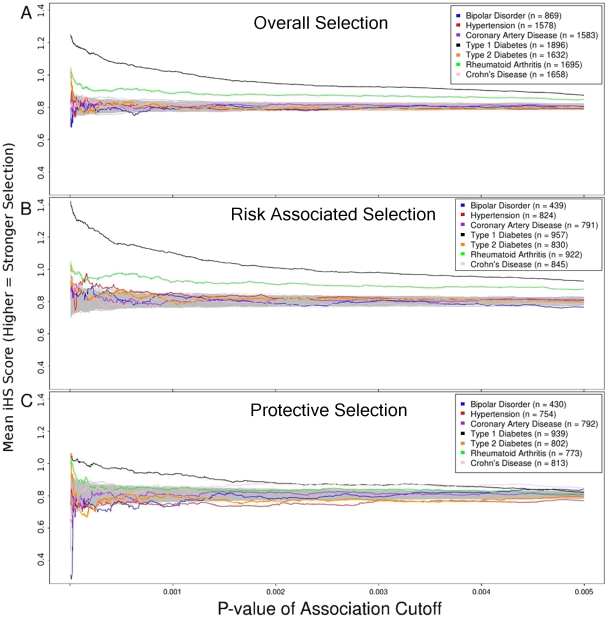
Figure 1. Selection in 7 WTCCC diseases.
Comparison of selection pressures reveals stark heterogeneity across the 7 diseases studied. The x-axis represents the p-value of association cutoff used for each disease when calculating the mean iHS score (y-axis). Figure 1a shows Type 1 Diabetes and Rheumatoid Arthritis have strong evidence of positive selection. Type 2 Diabetes shows signs of positive selection only in the most strongly associated SNPs (left side of figure). Figures 1b and 1c expose differences in selection of risk-associated and protective alleles. Crohn's Disease shows stronger positive selection of protective alleles versus risk alleles. Like Type 1 Diabetes, Hypertension shows stronger selection for risk alleles. The gray regions represent a neutral random region used as a control, created by randomizing the data (see Methods).

