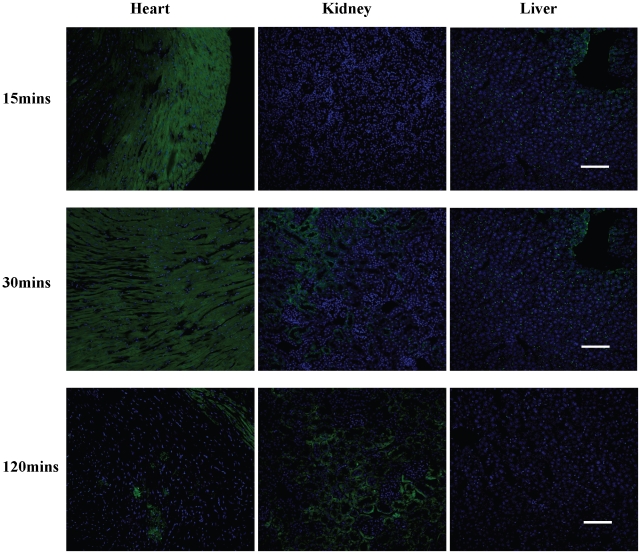
Figure 6. Pattern of distribution of CTP-biotin-SA488 over time in vivo.
Mice were injected intravenously with CTP-biotin-SA488 (10 mg/Kg) and euthanized 15, 30 or 120 minutes post-injection. Heart, kidneys and liver were cross-sectioned, counter-stained with DRAQ5 and confocal microscopy performed. N = 1 in each group; scale bars represent 100 uM.

