
Fig. 5.
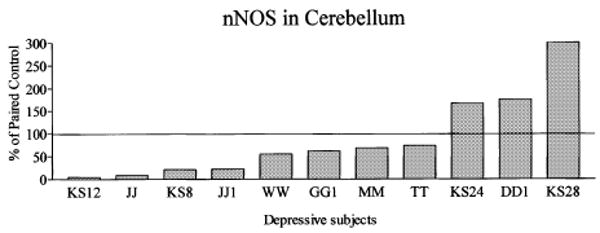
nNOS immunoreactivity in cerebelli of depressive subjects expressed as percentages of values from paired control subjects. Each bar is the average of duplicate comparisons. The overall relative amount of nNOS was modestly lower (− 12%) in the cerebellum among depressive subjects compared with individually matched control subjects, although this difference did not reach statistical significance.